
 Rapid growth in the renewable diesel market has some big implications for biodiesel, especially considering biomass-based diesel supply curves. In the latest of some really well-thought out analyses, University of Illinois Ag Marketing expert Scott Irwin gets into the issue of supply responsiveness from biodiesel to the broader category of biomass-based diesel. He starts out explaining the difference between biodiesel, renewable diesel and biomass-based diesel:
Biodiesel is a transportation fuel made from animal fats and vegetable oils by a process known as “transesterification.” Renewable diesel is also a transportation fuel made primarily from animal fats and vegetable oils, but by entirely different production processes compared to biodiesel. One process is known as “hydrodeoxygenation,” whereby heat, pressure, and a catalyst are used to remove oxygen from the biomass feedstock. Biomass-based diesel is generally defined as any form of biodiesel or renewable diesel.
Setting up those definitions, Irwin explains how to estimate the supply curve for both biodiesel and total biomass-based diesel:
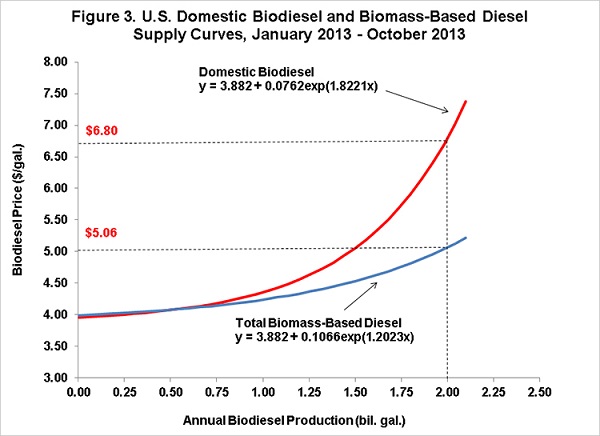
The estimated supply curves in Figure 3 are basically the same up to about one billion gallons of annual production but then diverge sharply for volumes above one billion gallons. For example, the estimates imply that a price of $6.80 per gallon is required in order for biodiesel production to reach 2 billion gallons, while a price of only $5.06 per gallon is required for total biomass-based diesel to reach 2 billion gallons. If costs and revenues per unit are approximately the same for biodiesel and renewable diesel, then one would expect the two supply curves to exhibit more of a parallel relationship because biodiesel is the largest component of total biomass-based diesel. In that case, the total biomass-based diesel supply curve would simply represent the horizontal summation at a given price of the biodiesel supply curve and the supply curves for the other three components of the total. The estimation results seem to imply that there are greater economies of scale to renewable diesel production. While this could be the case, an alternative explanation is that new renewable diesel production capacity came on line in 2013 and this skewed the results given the short sample period used to estimate the supply curves (10 months). Unfortunately, we may have to wait for another year in which the tax credit is set to expire in order to expand the sample in a meaningful way.
Irwin concludes that information shows that both domestic and foreign renewable diesel grew rapidly in the past year, and biomass-based diesel production was responsive to market prices, a fact that hasn’t grabbed a lot of attention. He goes on to say that since Renewable Fuel Standard compliance can be met with biodiesel or renewable diesel, this supply curve for total biomass-based diesel plays a key role in setting the market price of RINs.