
A new analysis from the University of Illinois shows that the biodiesel supply curve is key to the the price of Renewable Identification Numbers (RINs). Building on earlier work that showed that biodiesel production responds positively to profitability, Scott Irwin presents a new analysis to show the relationship between the biodiesel supply curve and the RIN prices.
The estimated supply curve for biodiesel in Figure 3 has several interesting characteristics. First, the slope of the curve increases as production increases, and in particular, relatively large price changes are required to move production above 2 billion gallons…
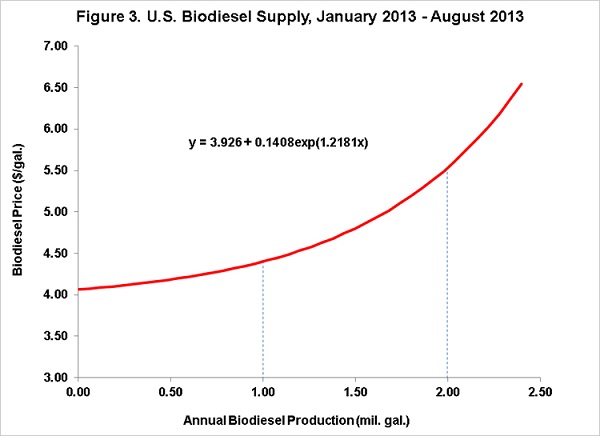
Second, the curve can be used to compute the elasticity of supply, which is simply the percent change in production for a one-percent change in price, all else held constant. The elasticity changes at each point along the curve for this functional form, so two examples are provided. At a production level of 1 billion gallons, the elasticity of supply is 8, implying that a 1 percent increase in price prompts an 8 percent increase in production. At a production level of 2 billion gallons, the elasticity of supply drops to 1.5, implying that a 1 percent increase in price results in only a 1.5 percent increase in production. The declining elasticity of supply as production increases makes sense since less and less excess capacity is available. Readers may also recall that much smaller production elasticities were reported in the September 25th post. This simply reflects the fact that a given cents per gallon increase in net returns is a much larger percentage increase relative to net returns as compared to price.
Third, the supply curve will shift if any of the variables held constant (price of soybean oil, natural gas, methanol, and glycerin) is allowed to change. By far the most important of these variables is the price of soybean oil since soybean oil feedstock costs represent over 80 percent of the total variable costs of biodiesel production for the type of plants assumed in this analysis.
The analysis concludes that the biodiesel supply curve declines rapidly as the level of biodiesel production increases, a reflection of capacity limits. And that all plays key roles in setting prices tradable RINs credits.