
 The Global Renewable Fuels Alliance (GRFA) has released a new chart that shows the opposite trends in the UN FAO’s Food Price Index (FPI) and world fuel ethanol production since 2008 from F.O. Licht’s 2017 forecasts.
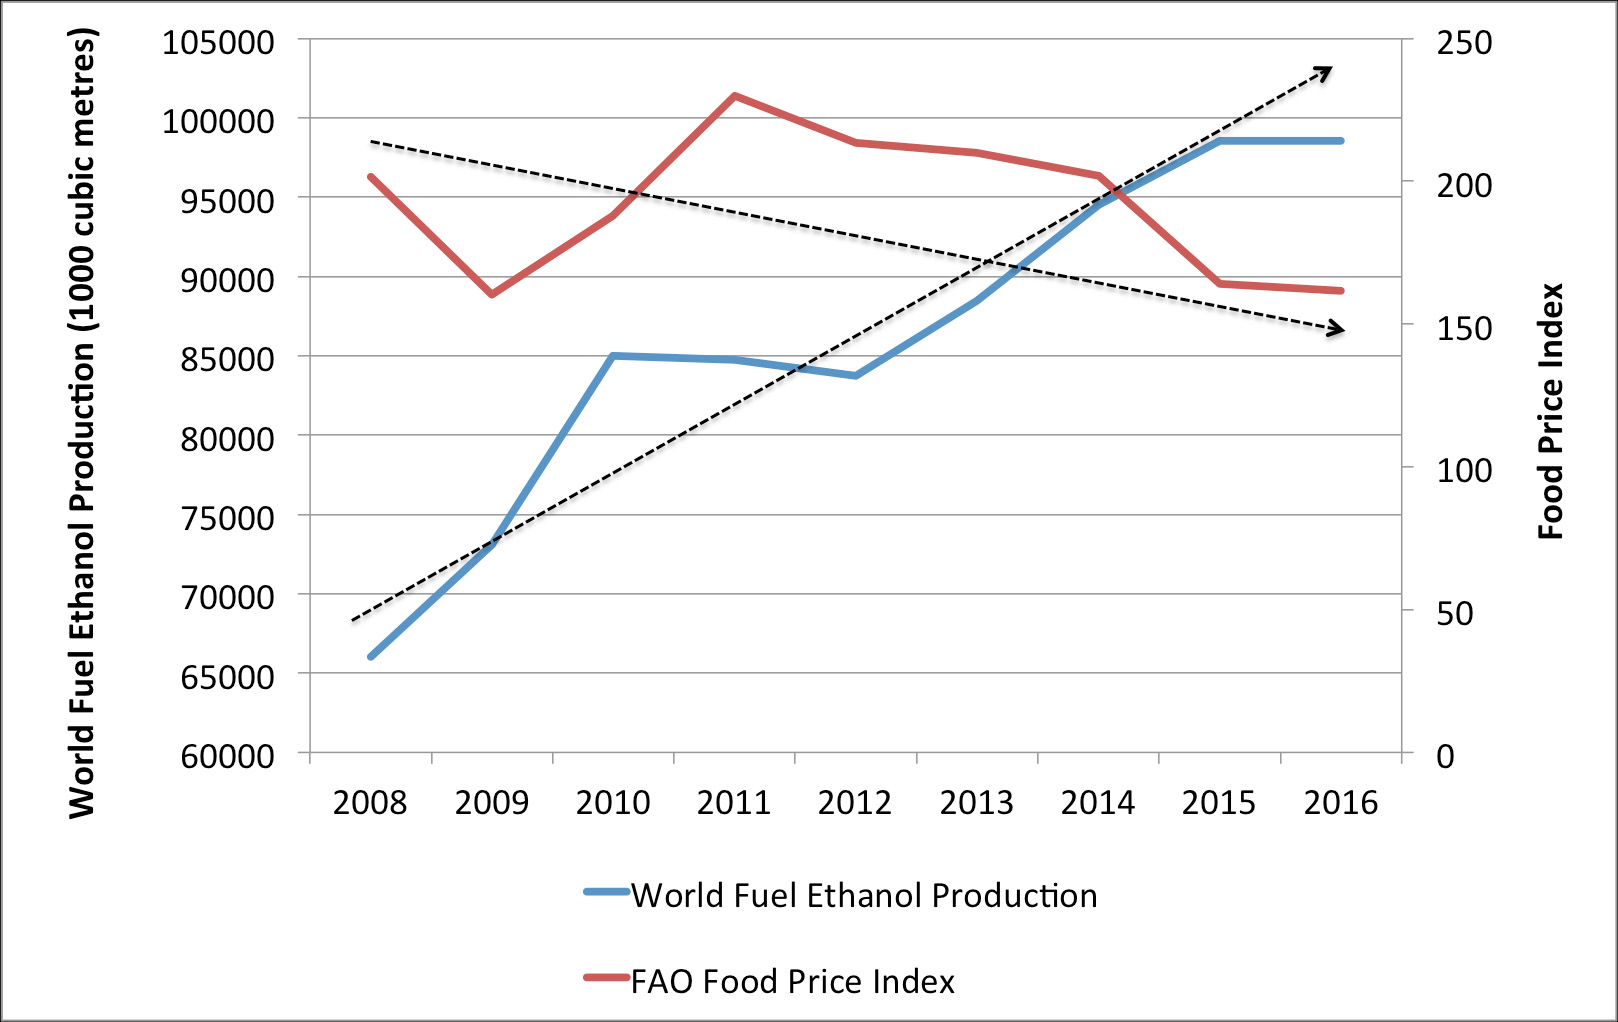
GRFA president Bliss Baker says the graph clearly demonstrates that “ethanol production is not a main driver of global food prices.” The chart shows a steady decline in the FPI from a peak of 229.9 points in 2011 to 161.5 points in 2016 which parallels the drop in annual oil prices over the same period from $94.88 to $43.15.
By contrast, this decline in food prices has coincided with a period of record ethanol production expansion, rising from 87 billion litres in 2011 to 98.5 billion litres in 2016, a 16% increase over this period. This disparity clearly demonstrates that increased ethanol production does not drive food prices.
“Real world data has long contradicted speculation about ethanol production driving up food prices,” Baker said. “These latest figures should finally put to rest any “food vs. fuel” concerns with ethanol production and are consistent with findings by the World Bank which concluded that almost two thirds of food price increases are caused by rising oil prices,” he added.